 AgentNod
Dashboard
What your agents did today, and what it cost
The AgentNod window opens on four tiles: how many agents are running, what you decided today, what the day cost and how much of your limits is left. History keeps the last 30 days.
Join the beta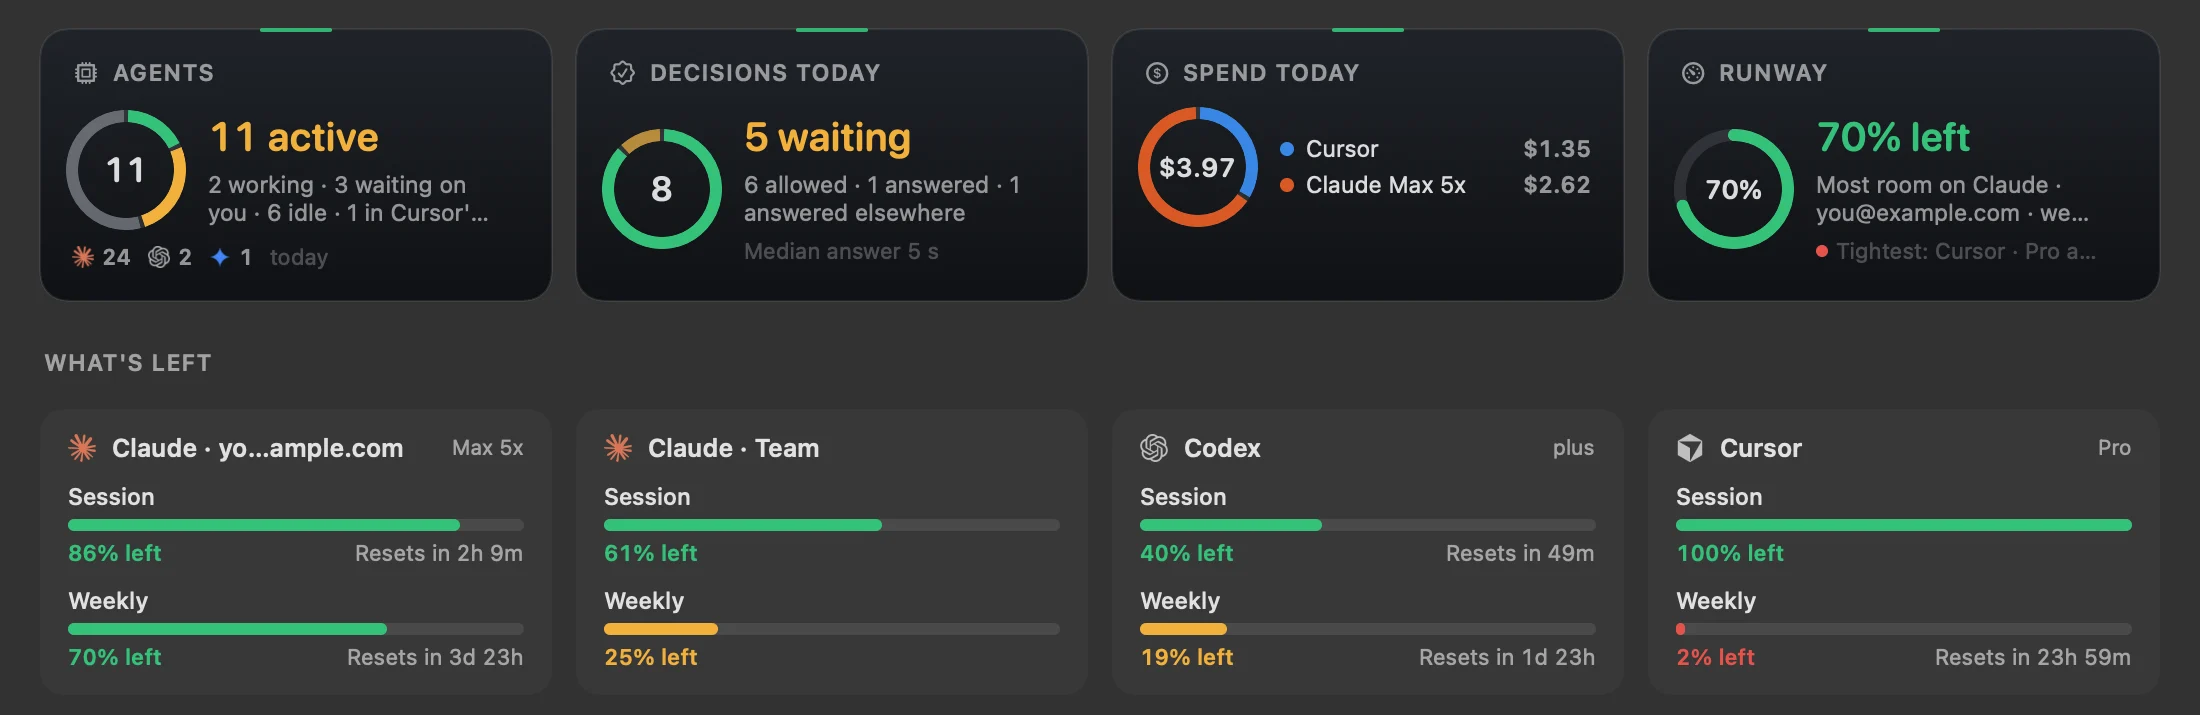
The four tiles
Agents. How many sessions are active, split into working, waiting on you and idle, with scheduled runs and Cursor's cloud agents beside them, and the day's sessions per agent.
Decisions today. What you allowed, denied and answered, what rules answered for you, what you answered elsewhere, and your median answer time.
Spend today. The day's spend per account as a ring. Without OpenUsage, the tile shows an estimate from the agents' own transcripts, marked ≈.
Runway. The account with the most room left and when that limit resets, and the account closest to empty.
What's left
Under the tiles, each account shows its limits as bars with the time to the next reset: session and weekly for Claude and Codex, and Cursor's and Gemini's own. A bar turns amber, then red, as it runs out.
The menu bar can show the same figures per provider next to the AgentNod icon.
History
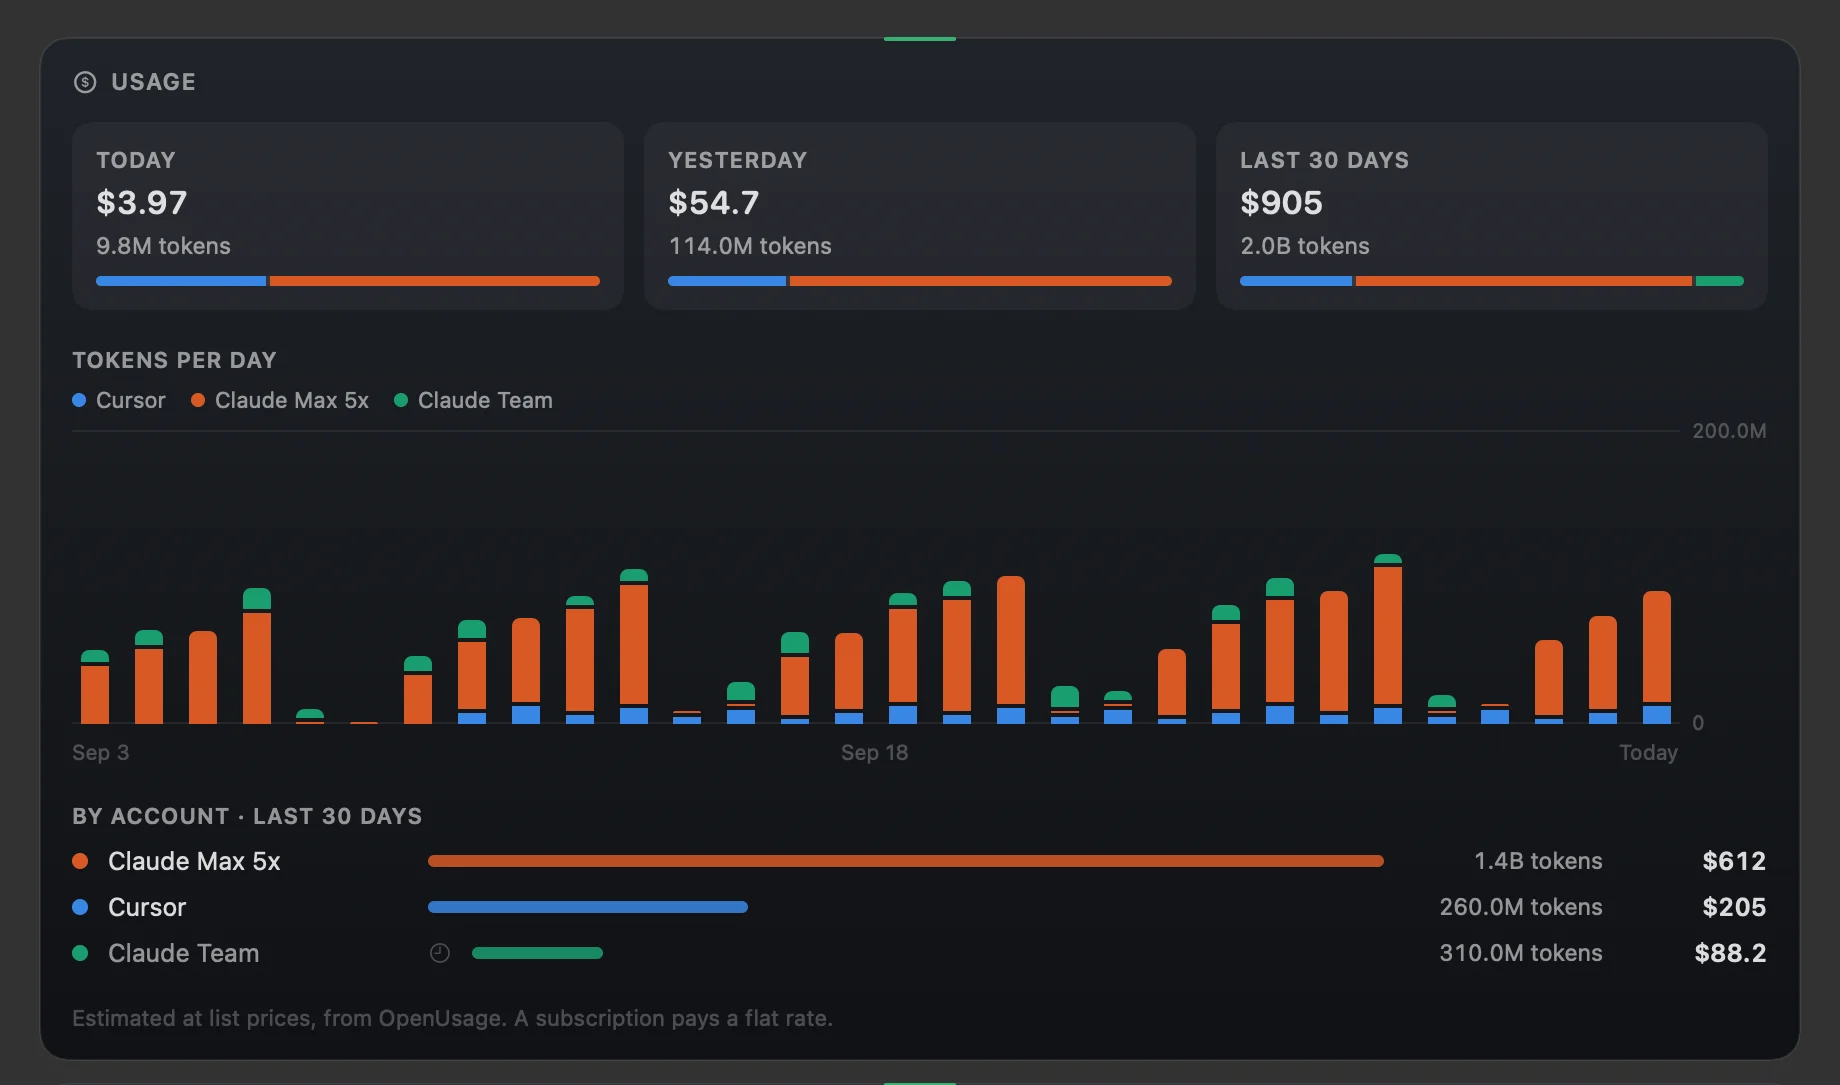
Usage. Spend and tokens for today, yesterday and the last 30 days, a bar per day stacked by account, and the 30-day total for each account.
Decisions per day. The last 14 days, coloured by outcome: yes, no, by rules, answered elsewhere. A line above the chart gives the share rules took and your median answer time.
Scheduled runs. The last 30 days of Claude's scheduled tasks, per task.
Where the numbers come from
Tokens, context fill and cost per session come from the agent's own transcript on your Mac. Each session row carries them, for example ctx 38% · 3.2M tok · ≈$11.32.
Account limits and spend by day come from OpenUsage, an open-source app, over its local API on 127.0.0.1. Codex limits also come from Codex's own log. AgentNod never reads your credentials and never calls a vendor's API.
Cost is an estimate at public list prices. A subscription pays a flat rate, so read the figure as usage and never as a bill.